Loading…
About the project
A real photovoltaic facility, with its data in the open
The Solar Demo Center is a facility of the Solar Energy Institute (IES) of the Universidad Politécnica de Madrid, created within the framework of a collaboration agreement with Trina Solar, one of the world's leading manufacturers of photovoltaic modules.
The center hosts solar trackers with two-axis tracking: the structure turns to keep the panels facing the sun throughout the day, which increases the energy captured compared with a fixed structure. The facility serves as a platform for research, teaching and demonstration.
This web application is part of a Final Degree Project of the Telematics Engineering Degree (ETSIST-UPM), and aims to provide a tool for monitoring and visualizing the Demo Center's generation data.
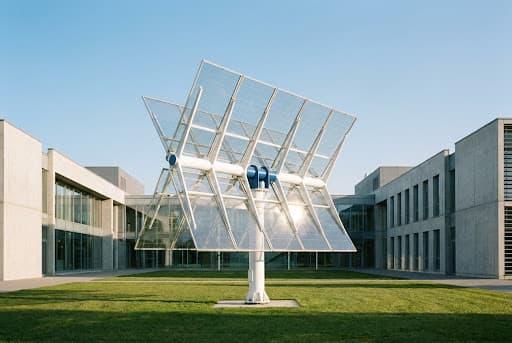
Illustrative image: this is not a photograph of this facility. The real photos are pending from the IES.
Partners
Universidad Politécnica de Madrid
Public university bringing together Madrid's technical schools of engineering and architecture, among them the ETSIST behind this project.
Solar Energy Institute
The UPM's photovoltaic research institute, active since 1979. It owns the Demo Center and the data this website publishes.
Trina Solar
Photovoltaic module manufacturer and partner in the agreement with the UPM that the Demo Center stems from.
How the monitoring is put together
Four layers separate the light hitting the panels from the number on your screen. Each hop uses the protocol that fits it:
The field
4 DC strings + AC meter
The meters on site read the 4 photovoltaic strings on the DC side, and a meter at the inverter output measures the AC side. One reading per minute.
Acquisition
UWP 4.0 · Modbus RTU
A Carlo Gavazzi UWP 4.0 datalogger installed on site polls every meter over an industrial bus and stores each reading. It is the single point where all the measurements come together.
Telemetry
SFTP to UPM · MQTT to the cloud
From there the data takes two paths. The one that feeds this site is a daily file the datalogger uploads over encrypted SFTP to a UPM server. The second is an MQTT channel to the cloud that was set up for development only and still has no consumer today: nobody stores those messages and they feed no page.
The application
PostgreSQL · API · browser
An automated job loads those files into a PostgreSQL database, this site's API queries it and the browser draws the charts. Everything you see always comes from that same database.
One protocol per hop
The route combines an industrial field bus, cloud telemetry, file transfer and a web API. That is not arbitrary: each hop has different requirements.
| Protocol | Hop | Why this one |
|---|---|---|
| Modbus RTU | VMU-S and EM540 meters → UWP 4.0 | It is the meters' native language and the de facto standard in photovoltaic installations. It runs over a short physical bus, with no network in between, and always answers predictably. |
| MQTT / TLS | UWP 4.0 → AWS IoT Core | Lightweight and built for telemetry: the datalogger publishes as soon as it has data, with its own per-device certificate. This channel was set up for development only and still has no consumer today, so it feeds none of what you see here. |
| SFTP | UWP 4.0 → UPM server | It comes built into the datalogger and yields one file a day with every measurement, without deploying anything extra on a shared server. It is reliable and can be reprocessed as many times as needed. |
| HTTPS / REST | This site's API → browser | What any browser already understands: individual requests, JSON responses and end-to-end encryption. The site asks for the aggregated data and draws it. |
Decisions you can feel when using the site
The first one is freshness: there is no real time here. Data arrives in a daily batch —today's file carries yesterday's measurements— and the loading job runs every six hours, so the most recent measurement available can be between one and about thirty hours old. Rather than hiding it, every page states when the data it shows is from.
The second one is that the data is open. The Demo Center's generation is published as is, with no sign-up and no key, through a public read-only API: anyone can download it, check it or use it in class. Data you cannot verify is no use for teaching.
The detail of how to read these measurements —the gaps, the completeness, how daily energy is computed and the API documentation— lives in the reading guide. How to read this data
Project timeline
2026
Web monitoring platform goes live
2026
Data opened up: public read-only API
Future
Per-tracker data and further analysis
The agreement with Trina Solar and the construction of the facility predate this project: their dates are pending confirmation by the IES and are therefore not dated here.
Opening up the data has already begun: the Demo Center's generation can be queried today through a public read-only API. See the data API
What comes next
The project does not end here. These are the open lines, with no dates committed:
From a daily batch to a minute
The MQTT channel to the cloud is already set up and tested. Writing a consumer that stores those messages in the same database would cut the wait from hours to minutes without changing anything else on the site.
Per-tracker data
Today the site talks about strings and about the plant because the match between each string and each tracker is still to be confirmed with the IES. Once it is, the tracker pages will be able to stop showing the plant aggregate.
Virtual tour
The 360° photographic tour was in the initial proposal and still stands: it depends on photographic material of the facility being available.
More analysis
With the facility's datasheet it would be possible to add indicators that cannot be computed honestly today, such as comparing what is generated with what the installed capacity would lead you to expect.
Want to know more?
Write to us if you would like to visit the facility, collaborate or use its data — or explore the Demo Center's generation in the dashboard.