Solar tracker 2
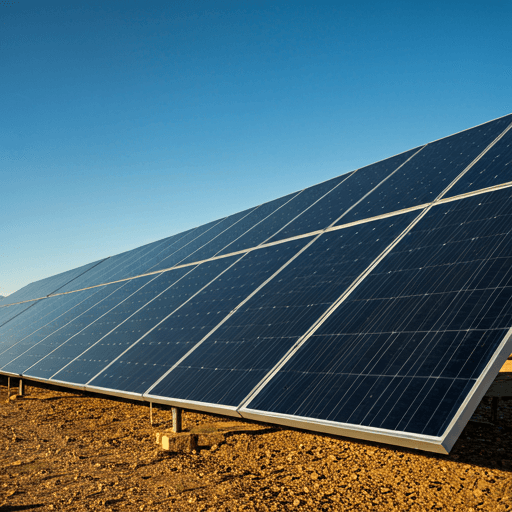
Illustrative image: this is not a photograph of this facility. The real photos are pending from the IES.
LocationDemo Center IES-UPM
Tracking2-axis tracking
Plant energy (aggregate of the 4 strings)
Monitoring measures 4 DC strings at plant level, and the string-to-tracker mapping is pending confirmation by the IES: this data belongs to the whole facility, not to this specific tracker.
| Parameter | Value |
|---|---|
| Energy · 11/08 | 150.6kWh |
| Peak power · 11/08 | 17.49kWDay's maximum, at 12:58 (Madrid time) |
| Generated since 25/06/2026 | 7.245MWhSum of the measured daily energy · 46 of 48 days with data |
Measurements from the Gavazzi UWP 4.0 datalogger, aggregated across the 4 DC strings. There are no instantaneous figures here (the current or power of a single sample): data arrives in a daily file whose last row is always the midnight close, so it would read zero overnight with nothing being wrong. Power is better read on the dashboard chart, across the day.